- Products ProductsLocation Services
Solve complex location problems from geofencing to custom routing
PlatformCloud environments for location-centric solution development, data exchange and visualization
Tracking & PositioningFast and accurate tracking and positioning of people and devices, indoors or outdoors
APIs & SDKsEasy to use, scaleable and flexible tools to get going quickly
Developer EcosystemsAccess Location Services on your favorite developer platform ecosystem
- Documentation
- Pricing
- Resources ResourcesTutorials TutorialsExamples ExamplesBlog & Release Announcements Blog & Release AnnouncementsChangelog ChangelogDeveloper Newsletter Developer NewsletterKnowledge Base Knowledge BaseFeature List Feature ListSupport Plans Support PlansSystem Status System StatusLocation Services Coverage Information Location Services Coverage InformationSample Map Data for Students Sample Map Data for Students
View Data Usage and Generate Reports
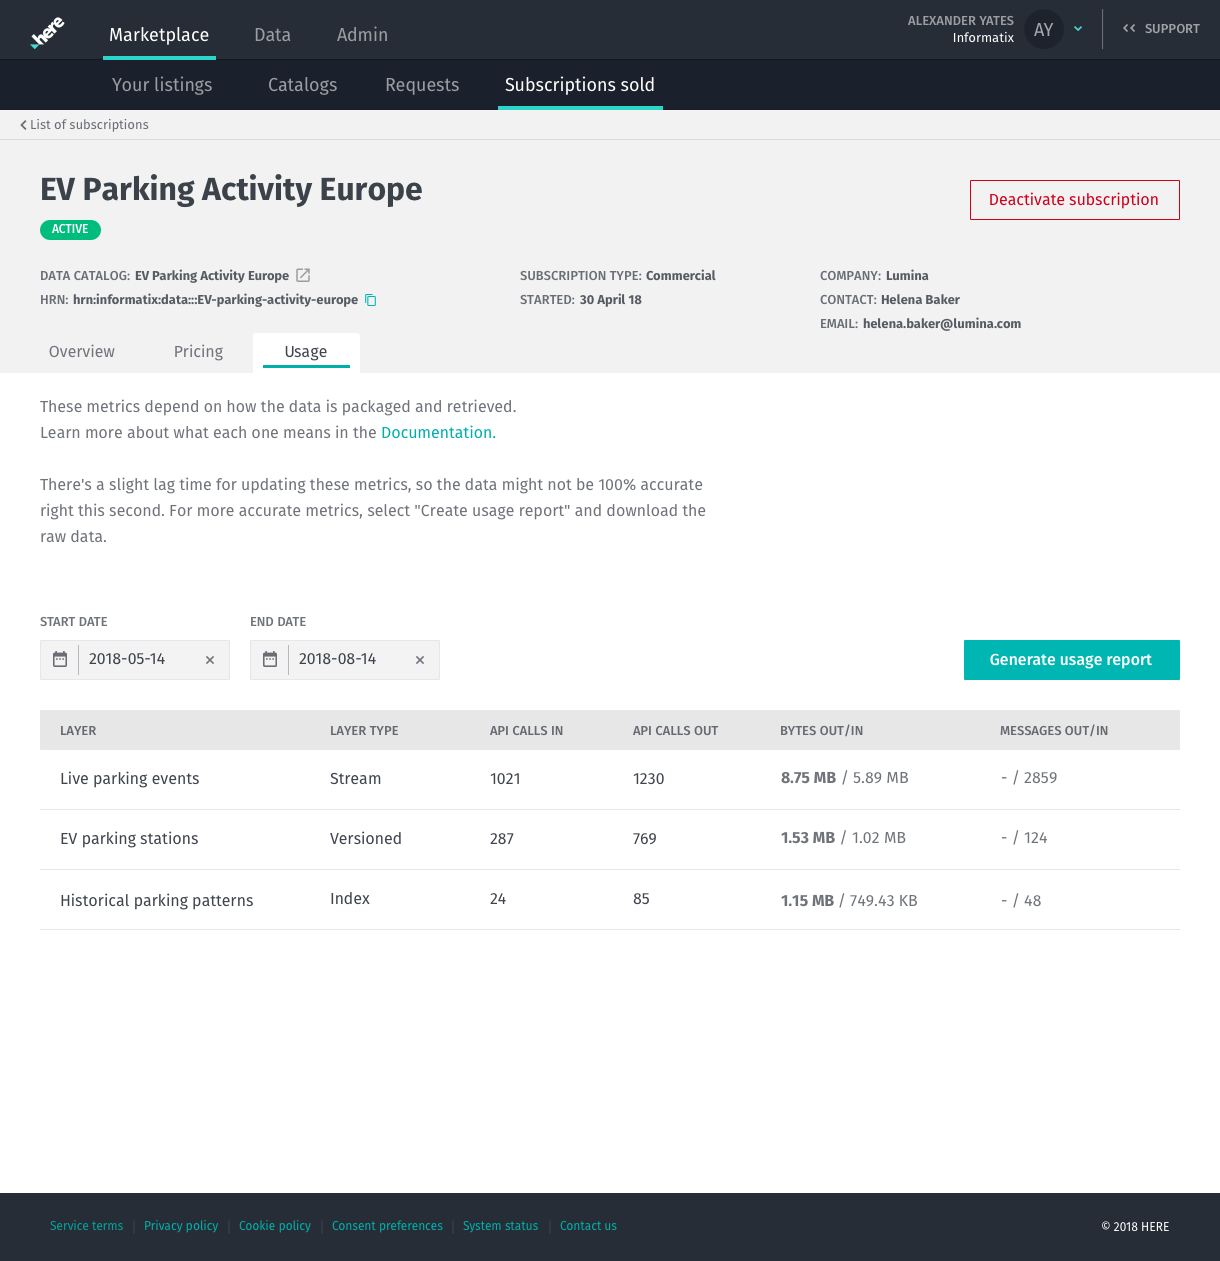
HERE Marketplace enables you to review your data usage and generate reports. Marketplace reports on two types of metrics, input and output. The input metrics represent the data that is published by the Provider and can be calculated via Bytes, APIs, or Messages. The output metric represents the data that is consumed by the Consumer and can be calculated via Bytes, APIs.
The platform allows using HTTP and/or Kafka connectors read from or write data to a stream layer. You can get metrics in the form of API calls when HTTP connectors are used or bytes in case of Direct Kafka connector.
You can generate reports for the catalog-based and the Neutral Server listing subscriptions.
Usage metrics for the catalog-based subscription
When using HTTP connector, you receive data in the form of API calls:
- API-Calls-In: The number of successful (aka. returns 2xx codes) PUT & POST methods being invoked. This metric applies to all data layer types.
- API-Calls-Out: The number of successful (aka. returns 2xx codes) HTTP GET methods returned. This metric applies to all data layer types and Neutral Server containers.
- Bytes_in: The volume of data published to a layer by a Provider. This metric applies to all data layer types.
- Bytes_out: The volume of data consumed from a layer. This metric applies to all data layer types.
- Messages_in: The number of discrete (unique) data objects that are available. This metric is only relevant to the streaming layer.
When using Kafka connector, you receive data in bytes:
- Bytes_in: The volume of data published to a layer by a Provider. This metric applies to all data layer types.
- Bytes_out: The volume of data consumed from a layer. This metric applies to all data layer types.
Note
API calls usage metrics would not be available if you read or write data via Kafka connector.
Usage metrics will be slightly higher than actual payload due to Kafka overhead and extra metadata.For Provider, the overhead is low. For Consumer, overhead is accumulated while there is a running Consumer. If Consumer has a 24/7 running pipeline to pull data from the stream layer and there is nothing that was ever published to this layer –, there still would be bytes_out metrics reported. The approximate overhead is 150bytes-1k/s, depending on how many partitions exist in the topic.
Usage metrics for the Neutral Server subscription
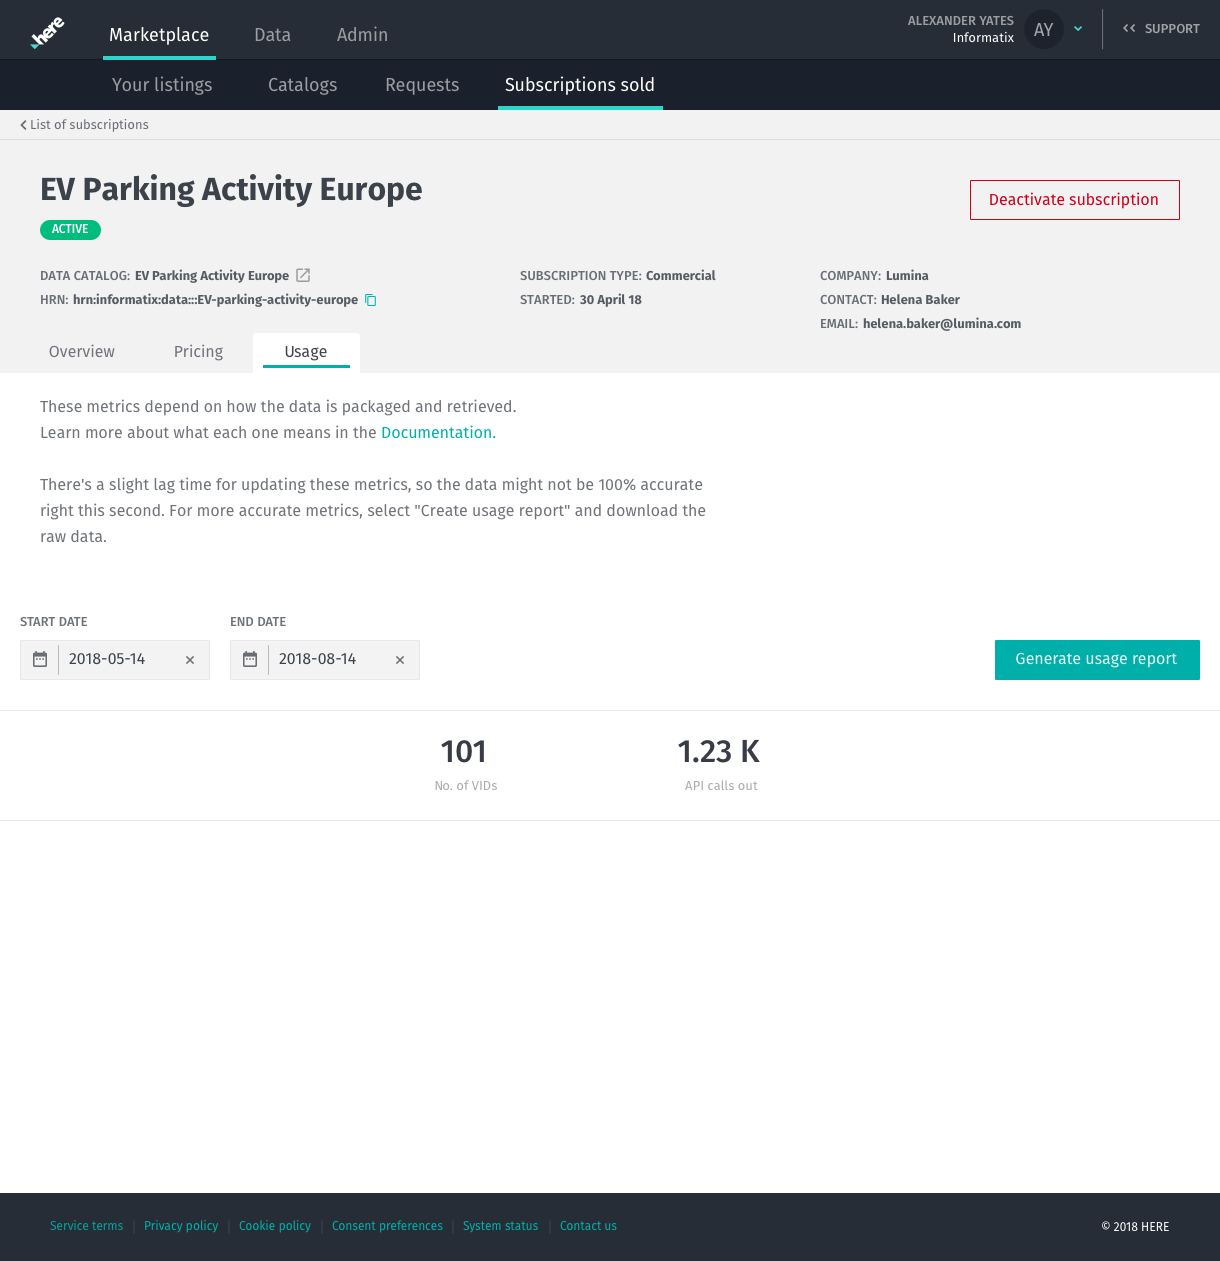
- No. of VIDs: The number of unique vehicle IDs that the Marketplace consumer retrieved from Neutral Server containers during the reporting period.
- API-Calls-Out: The number of successful (aka. returns 2xx codes) HTTP GET methods returned. This metric applies to all data layer types and Neutral Server containers.
Note
Data is updated every 24 hours. When generating a report, allow at least 24 hours from the day range selected for accurate metrics.
View Data Usage and Generate Reports
- From the Your Subscriptions screen, select the desired subscription to review.
- Click Start Date and End Date from the drop down menus.
- Click Generate report to download the report in a CSV file.
Note
Using the List view, you can filter based on company or get all data.


Note
If you want to cancel a subscription, contact your provider directly.